Market
Learn more about the current state of Tysons’ real estate market across the office, residential, retail, and hospitality sectors.
Office
Office
29.5M
Office Inventory SF
This metric shows the total square footage of existing office space in Tysons. Source: CoStar, Tysons Tracker
Office
4.3M
Total Office SF delivered since 2010
This metric shows the square footage of office space delivered in Tysons since the adoption of the 2010 Tysons Comprehensive Plan. Source: Tysons Tracker, TCA Development Pipeline
Office
21.4M
Maximum Approved Office SF
This metric shows the total square footage of office space approved and unbuilt in Tysons by either CDP, FDP or Site Plan. Source: Tysons Development Pipeline
Office
16%
% Office Inventory that is Trophy
This metric shows the percentage of office space in Tysons that is Trophy quality. Source: Stream Realty Partners
Employment
Annual Employee Visits
Employment
Monthly Employee Visits (Previous 12 Months)
Office
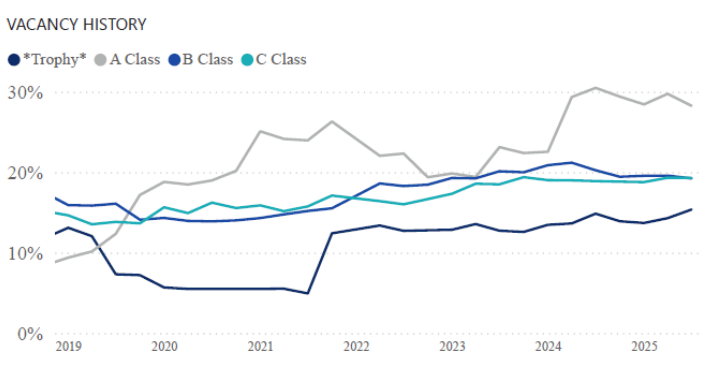
20%
Office Vacancy
This metric shows the most recent quarterly average office vacancy rate in Tysons. Source: CoStar
Office
$37.77
Avg. Market Asking Rent/SF
This metric shows the average asking rent for a square foot of office space in Tysons. Source: CoStar
Office
14%
Trophy Office Vacancy
This metric shows the average vacancy rate for a square foot of Trophy quality office space in Tysons. Source: Stream Realty Partners
Office
$63.83
Trophy Office Avg. Asking Rent/SF
This metric shows the average market asking rent for a square foot of Trophy quality office space in Tysons. Source: Stream Realty Partners
Office
-27.8K
Net Absorption SF
This metric shows the total net change in office square footage leased by tenants in Tysons in the last quarter. Source: Stream
Office
$161
Avg. Market Sales Price/SF
This metric shows the average annual sales price for a square foot of office space in Tysons. Source: CoStar

Residential
Residential
19.8M
Residential Inventory SF
This metric shows the total residential square footage in Tysons. Source: Tysons Tracker
Residential
16k
Residential Inventory Units
This metric shows the total number of existing housing units in Tysons. Source: Tysons Tracker
Residential
1.2M
Residential SF Under Construction
This metric shows the total square footage of residential space under construction in Tysons. Source: TCA Development Pipeline
Residential
1,058
Units Under Construction
This metric shows the total number of housing units under construction in Tysons. Source: TCA Development Pipeline
Residential
92%
Units Under Construction that are Affordable (%)
This metric shows the percentage of housing units under construction in Tysons that are affordable. Source: TCA Development Pipeline
Demographic
32K
Total Population
This metric shows the estimated current total population within the Tysons CDP boundary. This estimate utilizes the most recent census data and projects growth to the current year (2025). Source: Data Axle (via Esri)
Residential
93%
Residential Occupancy
This metric shows the most recent quarterly average residential occupancy rate in Tysons. Source: CoStar
Residential
$2.99
Avg. Market Asking Rent per SF
This metric shows the most recent quarterly average rent per square foot for a multi-family residential unit in Tysons. Source: CoStar
Residential
Distribution of Existing Units
Residential
Percent Owned and Rented Units

Residential
8M
Total SF of Residential Delivered since 2010
This metric shows the square footage of residential delivered in Tysons since the adoption of the 2010 Comprehensive Plan. Source: Tysons Tracker, TCA Development Pipeline
Demographic
4.6%
Projected Avg. Annual Pop. Growth 2023-30
This metric shows the projected average annualized population growth of Tysons between 2023 and 2030. Source: Fairfax co. / 2023 Market Study
Retail
Retail
6.1M
Retail Inventory SF
This metric shows the total square footage of existing retail space in Tysons. Source: Tysons Tracker
Retail
10K
Retail SF Under Construction
This metric shows the total square footage of retail space under construction in Tysons. Source: TCA Development Pipeline
Retail
$44.32
Avg. Market Asking Rent per SF
This metric shows the average asking rent for a square foot of retail space in Tysons in the most recent quarter. Source: CoStar
Retail
2.4%
Retail Vacancy
This metric shows the most recent quarterly average retail vacancy rate in Tysons. Source: CoStar
Retail
Annual Visits
Retail
Monthly Visits (Previous 12 Months)
Retail
65%
Origin of Retail Spending
of the $2.4B spent in Tysons emanates from visitors.
This metric shows the percentage of retail sales in Tysons that are generated by visitors. Source: Claritas
Economy
8%
Share of Fairfax County's Total Sales Tax Revenue
This metric shows the percentage of Fairfax County's sales tax revenues that are generated within Tysons. Source: 2024 Net Fiscal Impact Analysis

Retail
309
Total Retail Stores
This metric shows the number of clothing, furniture, electronic, sport/hobby, general merchandise, garden and other misc. retail locations in Tysons as of Q3 2025. Source: CoStar
Retail
160
Total Restaurants & Bars
This metric shows the number of restaurants (dine-in & fast food) and bars in Tysons as of Q3 2025. Source: CoStar
Retail
45
Total Entertainment Venues
This metric shows the number of movie theatres, gym/sports facilities, spas, hobby stores, performing arts facilities, book stores, and bowling alleys in Tysons as of Q3 2025. Source: CoStar
Retail
6
Total Grocery Stores
This metric shows the number of grocery stores in Tysons in 2025. Source: CoStar/ TCA
Retail
108%
Retail Recovery Index
Compared to Q4 2019
This metric shows the composite average percentage change in visits to Tysons retail locations between the most recent quarter and the same quarter baseline in 2019. 100% represents the same number of visits this year as 2019, while anything above represents an increase or below a decline. Source: Placer.ai

Hospitality
Hotel
16
Hotel Inventory
This metric shows the current number of operating hotels in Tysons. Source: CoStar
Hotel
3.9K
Number of Hotel Rooms
This metric shows the total number of hotel rooms in Tysons. Source: CoStar
Hotel
94K
Existing Meeting Space SF
This metric shows the total square footage of convening spaces in Tysons. Source: Kalibri Labs
Hotel
67%
Average Occupancy
This metric shows the most recent quarterly average occupancy rate of all hotels in Tysons. Source: Kalibri Labs
Hotel
Percentage of Hotel Revenues by Type
Hotel
$198.38
Average ADR per night
This metric shows the most recent quarterly average daily rate for all hotel rooms in Tysons. Source: Kalibri Labs
Hotel
$132.87
Average RevPAR
This metric shows the most recent quarterly average revenue per available room rate for all hotels in Tysons. Source: Kalibri Labs

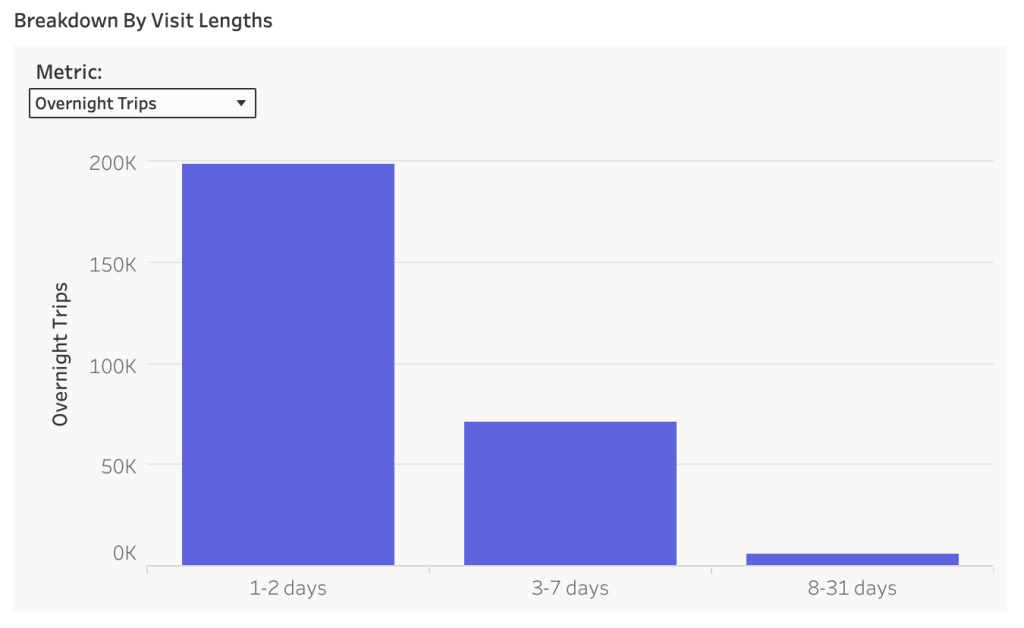
Hotel
360.2K
Over-Night Trips
This metric comes from the Placer domestic travel and tourism report. Overnight trips counts the total number of separate overnight trips (i.e. trips that include 1 or more overnight stays) made to Tysons within the selected timeframe, including multiple visits by the same person (so long as the multiple visits are in separate months; Multiple visits by the same person within a given month will be counted as 1 visit). Overnight Trips are counted for visitors whose home location is at least 10 miles away Source: Placer.ai
Hotel
+3.2%
Over-Night Trips YoY Change
Placer's overnight trips counts the total number of separate overnight trips (i.e. trips that include 1 or more overnight stays) made to Tysons, including multiple visits by the same person. Overnight Trips are counted for visitors whose home location is at least 10 miles away. This metric shows the % change in overnight visits compared to the same timeframe from the previous year. Source: Placer.ai
Hotel
+45%
Covid-19 Hotel Occupancy Recovery
Since 2021
This metric shows the percent increase in annual average hotel occupancy rate in Tysons for 2024 compared to the 2021 annual average, the lowest occupancy rate year as a result of the covid-19 pandemic. Source: CoStar